Trump posted on Truth Social at 8:03 this morning. Easter Sunday. "Tuesday will be Power Plant Day, and Bridge Day, all wrapped up in one, in Iran." He signed off with "Praise be to Allah."
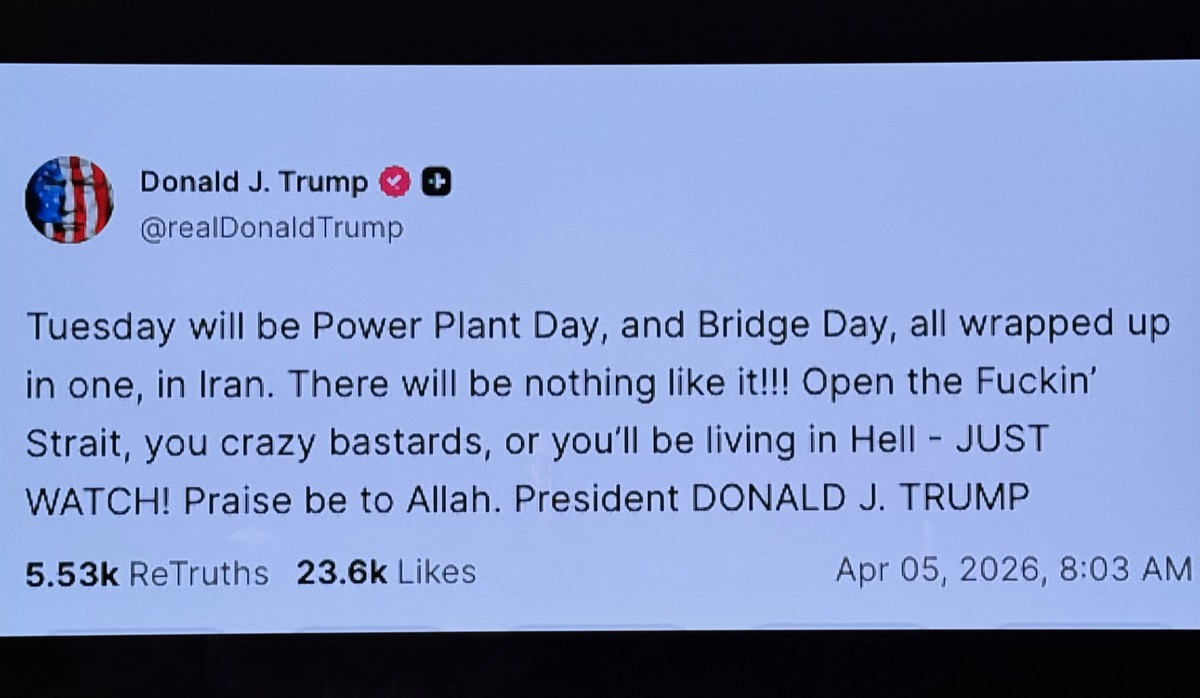
Make of that what you will.
An F-15E was shot down over central Iran on Thursday. The second crew member was rescued on Saturday after a firefight deep inside the country. Thirteen US service members have been killed since February 28. Three hundred and sixty-five wounded. Trump issued a 48-hour ultimatum on Friday. Reopen Hormuz by Tuesday 8pm ET or he hits Iranian power plants. Tehran said the strait stays shut until war damages are paid.
So that's where we are. A downed jet, a deadline, an Easter Sunday Truth Social post, and two governments calling each other's bluff.
Full methodology here. Live dashboard.
How Week 3 Landed
Last week's point estimate was $118.88 from a current price of $114.88. Brent futures closed at approximately $109.05 on Thursday 2 April, the last trading day before Good Friday.
That's a miss of roughly $9.83 on the high side.
The naive baseline would have predicted $114.88 (the previous price). Miss of about $5.83. The model lost to the naive baseline again. Three weeks, zero wins for the Monte Carlo.
Worth saying plainly, because this experiment is supposed to be honest.
But the physical price problem from Week 3 is getting worse, not better. Dated Brent physical hit $141.37 on April 2. That's the spot market for actual barrels of oil being loaded onto actual tankers. The gap between futures ($109) and physical ($141) is now $32. In Week 3 it was $11 ($115 vs $126). The model called $118.88. Physical said $141. Futures said $109. The model is sitting between two realities and neither one is validating it.
The experiment measures futures. Those are the rules. But the rules are measuring something increasingly disconnected from the commodity.
Scenario Probabilities
| Scenario | Week 3 | Week 4 | Change | Why |
|---|---|---|---|---|
| Escalation | 55% | 47% | -8 | The model overcalled at 55%. Trump is at maximum volume but volume isn't signal. He's extended deadlines before. The market priced in chaos weeks ago |
| Stalemate | 18% | 23% | +5 | Five weeks, no decisive breakthrough. Grinding war is becoming the structural baseline, not a transition state |
| De-escalation | 7% | 7% | 0 | "Strait stays shut until war damages paid." Not a negotiating position |
| Demand Destruction | 12% | 15% | +3 | JPMorgan $150 warning. Goldman adverse $140. Five weeks above $109 is a cost structure, not a spike |
| Black Swan | 8% | 8% | 0 | Composition changed. IRGC declared US ICT/AI companies legitimate targets Apr 1. Axios npm attack same day. Cyber front folded in |
Escalation dropping 8 points during Trump's most aggressive week of the war is the contrarian call. Here's the reasoning.
The model called $118.88 at 55% escalation. Brent settled at $109. The escalation probability was too high relative to what actually moved markets. The market has been absorbing escalation rhetoric since Week 1. Three "final deadline" extensions. Two nuclear facility strikes. Houthi entry. Pentagon ground invasion leaks. Every single one was supposed to break futures above $115 permanently. None of them did. Futures keep reverting to the $105-112 range while the physical market screams at $141.
So either futures are wrong and about to catch up to physical (in which case 47% is too low and $123 is too low and everything is too low), or the futures market has structurally discounted escalation rhetoric in a way the model hasn't learned yet. I'm betting on the second. But I'm noting the first, because the $32 spread is the biggest counterargument to everything in this post.
The escalation split stays at 40% sustained, 60% spike-and-recovery. The spike-and-recovery pattern held through Weeks 1-3, even at higher baseline prices.
The Forecast
- Forecast date: 5 April 2026
- Target date: 10 April (Friday close)
- Current price: Brent $109.05 (2 April close, last confirmed settlement)
- Horizon: 5 trading days
- Point estimate: $123.53
- 50% confidence interval: $101.57 to $136.20
- 68% confidence interval: $81.53 – $140.39
- 90% confidence interval: $69.23 – $162.23
Naive baseline comparison: $109.05 (current price as prediction)
The point estimate of $123.53 is $14.48 above the last confirmed settlement. That's the model's most directional call since Week 1. Escalation (47%, mode $135) still dominates the median even after the 8-point drop. If Trump follows through on the Tuesday ultimatum and hits energy infrastructure, the upper 90% bound of $162.23 is where physical Brent is already trading. If he extends the deadline again, the naive baseline wins and $123 looks silly.
The 90% interval spans $93. That's the widest it's been. The model isn't uncertain. The situation is uncertain. Demand destruction at $60-85 and black swan at $130-218 are doing the heavy lifting on the tails. Worth noting that the demand destruction floor ($60) probably needs recalibrating given five weeks of sustained $109+. That's a revision for Week 5.
Method: Bayesian scenario-weighted Monte Carlo, 10,000 samples, triangular distributions per scenario.
What I'm Watching This Week
- The Tuesday deadline. Trump's 48-hour Hormuz ultimatum expires Tuesday 8pm ET. This is the single most important variable. He's extended deadlines before (April 6 energy strike pause slid). But the F-15 shootdown changes domestic political dynamics. Backing down after losing a jet is harder than backing down after a speech.
- Physical vs futures convergence. Dated Brent physical at $141 while futures sit at $109 is a $32 spread. If that closes upward (physical drags futures higher), $123 is low. If it closes downward (resolution priced in), $123 is high. Watch the spread.
- Iran's response posture. They hit Kuwait. They hit Israel with their biggest salvo in three weeks. They shot down an F-15. Tehran is escalating too, not just Washington. The market is focused on Trump's ultimatum but Iran's actions are independently price-moving.
- The cyber dimension. If the IRGC declaration translates into sustained attacks on US tech infrastructure, that's a new front the oil market hasn't priced. The axios incident could be isolated or it could be the first move.
- Asian demand signals. China and India secured Hormuz transit but at 6 vessels per day. Are they buying at $141 physical? Their purchasing behaviour determines whether demand destruction is a spreadsheet scenario or an active price force.
Where I Could Be Wrong
Too conservative on escalation. If Tuesday's deadline lands and Trump hits Iranian power plants and bridges (as he posted this morning), $123 will look laughably low. The physical market is already at $141. Futures catching up to physical is the risk scenario nobody wants to model.
Too aggressive on the point estimate. Trump has issued and extended deadlines before. If Tuesday slides to Friday, then to next week, the stalemate scenario reasserts itself and Brent drifts back toward $105-108. The $14.48 upward drift in the point estimate is a bet on the escalation scenario dominating the median. If the deadline doesn't land, the naive baseline wins a fourth consecutive week, at which point the honest question is whether the Monte Carlo adds anything over "just use today's price."
Wrong frame entirely. The futures/physical spread might be telling me the model is looking at the wrong number. If the physical market is the true signal and futures are artificially compressed by financial positioning, then the experiment's pricing anchor is off. Three weeks of the model "overcalling" might actually be three weeks of the model being closer to the physical reality than the futures give it credit for. I don't have a clean answer for this yet.
Forecast locked 5 April 2026. No edits after publishing. Live dashboard here.
Previous: Week 3